12 Ways Power BI Service Can Transform Business Reporting in the USA & Canada | Soft-Korner
Business intelligence is no longer simply about creating reports. It's about helping people understand what is happening, why it is happening, and where a

Gary Nicholas
Business reporting has changed significantly in recent years. Companies no longer want to wait for static monthly reports to understand what's happening across sales, finance, marketing, operations, and customer service.
They want faster access to reliable information.
They want interactive dashboards.
They want to identify trends before they become problems.
Most importantly, they want their data to support better business decisions.
This is where Power BI Service can provide significant value.
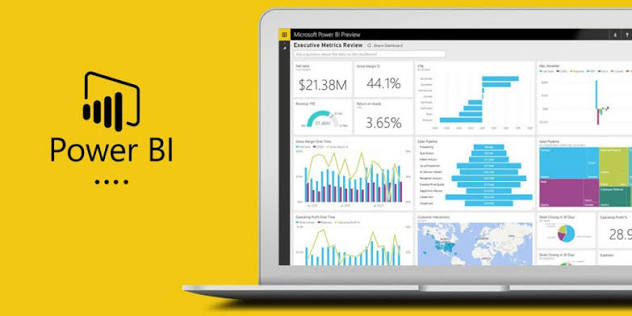
Power BI Service is Microsoft's cloud-based business intelligence environment that enables organizations to publish, share, manage, and interact with reports and dashboards. When implemented strategically, it can help businesses create a more connected and efficient approach to reporting.
For organizations across the USA and Canada, Power BI can support everything from executive dashboards and financial reporting to sales analytics and operational performance monitoring.
In this article, we'll explore 12 ways Power BI Service can transform business reporting and explain how professional Power BI services can help organizations get more value from their data.
What Is Power BI Service?
Power BI Service is the online, cloud-based component of the Microsoft Power BI platform.
It allows organizations to work with business intelligence content after reports and models have been developed and published.
Businesses can use Power BI Service to:
Publish reports and dashboards
Share information with authorized users
Create workspaces
Distribute Power BI apps
Monitor business KPIs
Explore data interactively
Configure data refresh processes
Manage permissions
Collaborate around business intelligence
For growing organizations, Power BI Service can provide a centralized environment for accessing and managing business reporting.
1. Replace Static Reports With Interactive Dashboards
Traditional reports often provide a fixed snapshot of business performance.
If a manager wants to investigate a specific region, product, customer, or time period, they may need to request another report.
Power BI Service can make reporting interactive.
Users can work with dashboards and reports using filters, selections, and different views of the underlying information.
For example, a sales dashboard could allow a manager to examine revenue by:
Product
Region
Customer
Sales representative
Month
Industry
Instead of simply reading a report, users can explore the information themselves.
This can make business reporting more useful and responsive.
2. Bring Data From Multiple Systems Together
Business data is often spread across multiple applications.
An organization may use separate systems for:
CRM
ERP
Finance
Marketing
Inventory
Customer service
Operations
Analyzing each system independently can make it difficult to understand overall performance.
Power BI supports connections to many types of data sources, allowing organizations to develop reporting solutions that bring relevant information together.
For example, a business could combine customer, sales, and marketing information to understand the complete customer journey.
This can create a more comprehensive view of business performance.
3. Improve Executive Decision-Making
Executives don't necessarily need hundreds of pages of reports.
They need clear information about the metrics that matter most.
An executive Power BI dashboard might display:
Revenue
Profitability
Sales growth
Customer growth
Regional performance
Strategic KPIs
Target achievement
Visual dashboards can make it easier to identify significant changes and trends.
Instead of spending hours reviewing spreadsheets, leadership can start with a high-level view and investigate specific areas when necessary.
This can support faster and more informed decision-making.
4. Make KPI Monitoring More Effective
Every business has metrics that indicate whether it is performing as expected.
These may include:
Revenue
Profit margin
Conversion rate
Customer retention
Sales growth
Inventory turnover
Operating expenses
Customer acquisition cost
Power BI Service can bring these KPIs into centralized dashboards.
This allows authorized users to monitor performance according to the organization's reporting and refresh configuration.
If a KPI moves in an unexpected direction, managers can investigate the underlying data and determine what may be driving the change.
5. Reduce Manual Reporting Work
Manual reporting can consume valuable employee time.
A typical reporting process might involve:
Exporting data from different systems.
Combining multiple spreadsheets.
Cleaning information.
Updating formulas.
Creating charts.
Checking calculations.
Formatting the final report.
Sending it to stakeholders.
Power BI can streamline many parts of this process through connected data sources, reusable models, dashboards, and configured refresh processes.
Reducing repetitive reporting tasks can allow employees to spend more time analyzing results instead of preparing reports.
6. Improve Sales Performance Visibility
Sales teams need more than total revenue numbers.
They often need to understand:
Which products are selling?
Which regions are growing?
Which customers generate the most revenue?
Are sales representatives meeting targets?
Which opportunities are progressing?
Which markets are underperforming?
Power BI dashboards can bring these metrics together.
For example, a sales manager could start with total revenue and drill into regional, product, or representative performance.
This can make it easier to identify both opportunities and potential problems.
7. Strengthen Financial Reporting
Financial reporting is another area where Power BI can provide valuable visibility.
Finance teams can build dashboards around:
Revenue
Expenses
Profitability
Budgets
Forecasts
Cost trends
Department performance
A financial dashboard can make it easier to compare actual results against targets or previous periods.
Management can then investigate unexpected changes and determine where further analysis is required.
For growing businesses, this type of centralized reporting can support better financial planning.
8. Support Better Marketing Analytics
Marketing teams often manage campaigns across multiple channels.
They may need to analyze:
Leads
Website traffic
Campaign performance
Conversion rates
Marketing spend
Customer acquisition costs
Revenue generated
Power BI can bring marketing data into visual dashboards that help teams compare performance.
For example, marketing managers could analyze which channels generate the most qualified leads or which campaigns contribute most effectively to revenue.
This can help businesses make more informed decisions about marketing investments.
9. Improve Operational Visibility
Operations teams need to understand what is happening across everyday business processes.
Depending on the organization, operational reporting may include:
Inventory
Production
Delivery
Supply chain
Resource utilization
Productivity
Service performance
Power BI Service can bring operational information into dashboards that help managers monitor performance.
Instead of waiting for periodic reports, teams can use configured reporting environments to investigate operational trends and identify areas that need attention.
10. Enable Better Collaboration Between Departments
Different departments often look at the business from different perspectives.
Sales focuses on revenue.
Finance focuses on profitability.
Marketing focuses on campaigns and customer acquisition.
Operations focuses on efficiency.
Leadership needs to understand all of these areas together.
Power BI Service can provide a shared reporting environment where departments access relevant dashboards and reports.
This can encourage teams to work with more consistent definitions and KPIs.
When departments use common business metrics, communication can become easier and reporting discrepancies can be reduced.
11. Scale Business Intelligence as Your Organization Grows
Reporting requirements rarely stay the same.
As businesses grow, they may add:
New employees
New locations
New products
New customers
New markets
New business systems
New departments
Power BI can support the gradual expansion of an organization's business intelligence environment.
Companies can introduce additional reports, dashboards, workspaces, data sources, and reporting use cases over time.
This makes it possible to start with a focused project and expand as the business becomes more mature.
12. Create a Foundation for Long-Term Data-Driven Growth
Perhaps the biggest advantage of Power BI Service is its ability to become part of a broader data-driven business strategy.
Organizations can move from basic reporting toward more advanced analytics as their data maturity improves.
A business might begin with:
Basic dashboards → KPI reporting → Departmental analytics → Enterprise reporting → Advanced business intelligence
This gradual approach allows organizations to develop their analytics capabilities without attempting to solve every reporting challenge simultaneously.
With the right strategy, Power BI can become an important part of how a company understands and manages its performance.
Power BI Consulting Services for a Successful Implementation
Power BI provides powerful capabilities, but organizations still need to determine how those capabilities should be applied.
This is where Power BI consulting services can help.
A consultant can help businesses assess:
Current reporting processes
Business objectives
Data sources
KPIs
Data architecture
Security requirements
Dashboard requirements
Governance needs
Professional consulting can help ensure that Power BI development is connected to actual business priorities.
The goal should not be to create as many dashboards as possible.
The goal should be to create the dashboards that help people make better decisions.
Power BI Development Services for Customized Reporting
Different businesses have different reporting requirements.
A retailer may need inventory analytics.
A manufacturer may need production dashboards.
A financial services company may need profitability and performance reporting.
A professional services company may need project analytics.
Power BI development services can create customized solutions around these requirements.
Development may include:
Data integration
Data transformation
Data modeling
Interactive dashboards
Custom reports
KPI development
Performance optimization
Business system integration
Custom development can help organizations create reporting environments that reflect their actual workflows.
Power BI as a Service for Flexible Business Intelligence
Not every company has the resources or need to build a large internal BI department.
Power BI as a Service can provide organizations with access to external Power BI expertise through a service-based model.
Depending on the provider, services may include:
Consulting
Development
Dashboard design
Implementation
Data integration
Optimization
Technical support
This can be particularly useful for small and medium-sized businesses that want professional analytics capabilities without maintaining a large internal team.
Power BI Managed Services for Ongoing Support
Business intelligence requires ongoing maintenance.
Data sources change.
Business KPIs evolve.
New reports are requested.
Existing dashboards may require optimization.
Users may need technical support.
Power BI managed services can provide ongoing assistance with the Power BI environment.
Managed support may include:
Dashboard maintenance
Report updates
Data refresh troubleshooting
Performance monitoring
User support
New dashboard development
Optimization
Technical assistance
This can help organizations maintain the value of their Power BI investment over time.
Power BI and Reporting Services for Modern Businesses
Traditional reporting often focuses on producing documents at regular intervals.
Modern business intelligence focuses more on providing continuous access to useful information.
Power BI and reporting services can help businesses develop a more centralized and interactive reporting environment.
Instead of asking employees to prepare a new spreadsheet for every question, organizations can provide dashboards that allow authorized users to explore information themselves.
This can improve:
Data accessibility
Reporting consistency
Decision-making
Collaboration
Operational visibility
How Businesses in the USA & Canada Can Use Power BI Service
Power BI Service can support businesses across many industries.
Retail
Retailers can monitor:
Store performance
Product sales
Inventory
Customer behavior
Regional performance
Manufacturing
Manufacturers can analyze:
Production
Supply chain
Inventory
Operational efficiency
Quality metrics
Professional Services
Professional services organizations can track:
Project profitability
Billable hours
Revenue
Customer performance
Employee utilization
Technology
Technology companies can monitor:
Customer growth
Sales pipeline
Subscription metrics
Product performance
Marketing results
Healthcare
Organizations can use appropriate Power BI reporting for operational, financial, and performance analytics while taking applicable privacy, security, and regulatory requirements into account.
The flexibility of Power BI allows businesses to adapt reporting to their particular industry and operating model.
How to Choose a Power BI Services Company
Choosing a reliable Power BI services company is an important step.
Before selecting a provider, consider:
Technical Experience
Does the company understand Power BI development, data modeling, integration, security, and performance?
Business Knowledge
Can the provider understand your organization's goals and KPIs?
Customization
Will the solution be designed around your specific requirements?
Scalability
Can the provider support your business as reporting requirements grow?
Ongoing Support
Does the company offer Power BI managed services after implementation?
A good partner should provide both technical expertise and practical business understanding.
Why Choose Soft-Korner?
At Soft-Korner, we help businesses turn complex data into clear and useful business intelligence.
Our Power BI services can support organizations looking for:
Power BI consulting
Power BI development
Custom dashboards
Interactive reports
Data integration
Data modeling
KPI reporting
Power BI managed services
Business intelligence support
We focus on understanding the business problem before designing the reporting solution.
For businesses across the USA and Canada, our goal is to help organizations build reporting environments that make data easier to understand and decisions easier to support.
Whether you are starting a new Power BI project, improving an existing reporting environment, or looking for ongoing support, Soft-Korner can help develop a solution aligned with your business objectives.
A Simple Power BI Service Roadmap
If your organization is ready to modernize its reporting, consider the following approach:
Identify business challenges. Determine which decisions need better information.
Audit your data. Identify where important information is stored.
Define KPIs. Choose metrics that directly support business goals.
Design the data model. Create a reliable foundation for reporting.
Develop dashboards. Build reports around specific user requirements.
Establish security. Configure appropriate access and governance.
Deploy through Power BI Service. Make reports available to authorized users.
Train employees. Help users understand how to navigate and interpret reports.
Monitor performance. Identify opportunities for optimization.
Continue improving. Add new reports and capabilities as business requirements evolve.
Final Thoughts
Business intelligence is no longer simply about creating reports.
It's about helping people understand what is happening, why it is happening, and where action may be needed.
Power BI Service can help businesses transform reporting by providing interactive dashboards, centralized business intelligence, data connectivity, KPI monitoring, collaboration, and scalable analytics.
For organizations in the USA and Canada, these capabilities can create a stronger foundation for data-driven decision-making.
However, successful Power BI implementation requires more than technology. Businesses also need effective strategy, reliable data, thoughtful dashboard design, appropriate security, and ongoing support.
That's why professional Power BI consulting services, Power BI development services, Power BI as a Service, and Power BI managed services can be valuable.
With the right approach, Power BI can evolve from a reporting tool into an important part of an organization's broader business intelligence strategy.
Soft-Korner can help businesses turn complex data into practical dashboards, reports, and actionable insights designed around their specific goals.
About the Author
Gary Nicholas
No bio available